How to find support and resistance levels
You can find support and resistance by hand with a repeatable method, and the same method can be automated so two people looking at one chart end up with the same levels. Here it is, step by step.
New to the idea? Start with what support and resistance are.
Step 1: pick one timeframe and stick to it
Choose the chart you actually care about: daily, hourly, 15-minute. Levels found on one timeframe belong to that timeframe. Mixing them is the most common reason two people disagree about "the" level.
Step 2: mark the swing highs and swing lows
A swing high is a bar whose high is the highest of the bars around it. A swing low is a bar whose low is the lowest. A simple, checkable rule: a bar is a swing point if it is the extreme of the five bars on each side of it.
Going by "it looks like a peak" is how levels end up different every time. A fixed rule gives the same points every time.
Step 3: group the swing points that sit close together
Swing points that land within a narrow band are one level. But what is "narrow"? Not a fixed percentage. Half a percent is huge on a quiet stock and tiny on a volatile one.
A better ruler is the instrument's own normal movement, its average true range (ATR): roughly how far it typically moves in one bar. Group swing points that sit within about half an ATR of each other, and the same rule works on a $200 stock, a $60,000 coin and a currency pair.
Step 4: count the touches
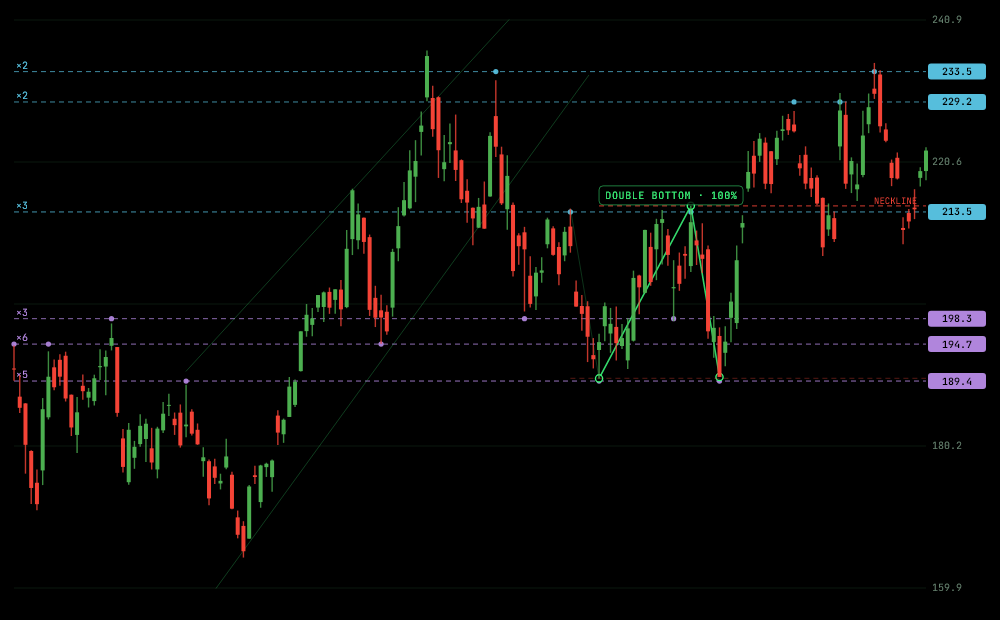
For each group, count the swing points in it. That is the number of times price turned there. Discard groups with fewer than two: a single turn is a swing point, not yet a level.
Step 5: weigh recency
A level last touched two weeks ago is live. One last touched ten months ago is history. When you have to choose which levels to keep, rank by touches and by how recently the last touch happened. Give touches a cap: past about four, another test says little more.
Step 6: check which side price is on now
A level built from old highs is support if price has since climbed above it, and resistance if price is still below. The label depends on where price is now, not on how the level was formed. If the group contains both highs and lows, price has been respected from both sides, so call it a flip level.
Step 7: note what else sits at the same price
Sometimes a moving average, such as the 50 or 200 period, sits at the same price as a level. Many people watch those averages, so a level that lines up with one has something else going on at that price. This is context, not confirmation.
Step 8: keep the list short
Stop at about six. If every level is on the chart, none stands out. The goal is a small set with real histories.
Not “buy here” or “sell there”. A short list of prices, each with a touch count and a date of the last touch. That is a fact sheet for your own decisions.
Doing this in seconds
These steps are the ones ChartPro follows. It uses a five-bar rule for swing points, groups them within half an ATR, needs at least two touches, ranks by touch count and recency, and shows the six strongest. Each level is labelled with its touch count and how far it sits from the current price.
Because it is a fixed method on real price bars, the same chart gives the same levels every time. Type a ticker, or upload a screenshot, and check it against your own work.
A quick way to sanity-check any level
- Can you point to each touch on the chart?
- Are there at least two, and is at least one recent?
- Would the level move much if you moved one swing point by a bar or two? If so, treat it as a zone.
- Are you looking at the timeframe you actually care about?