What is support and resistance?
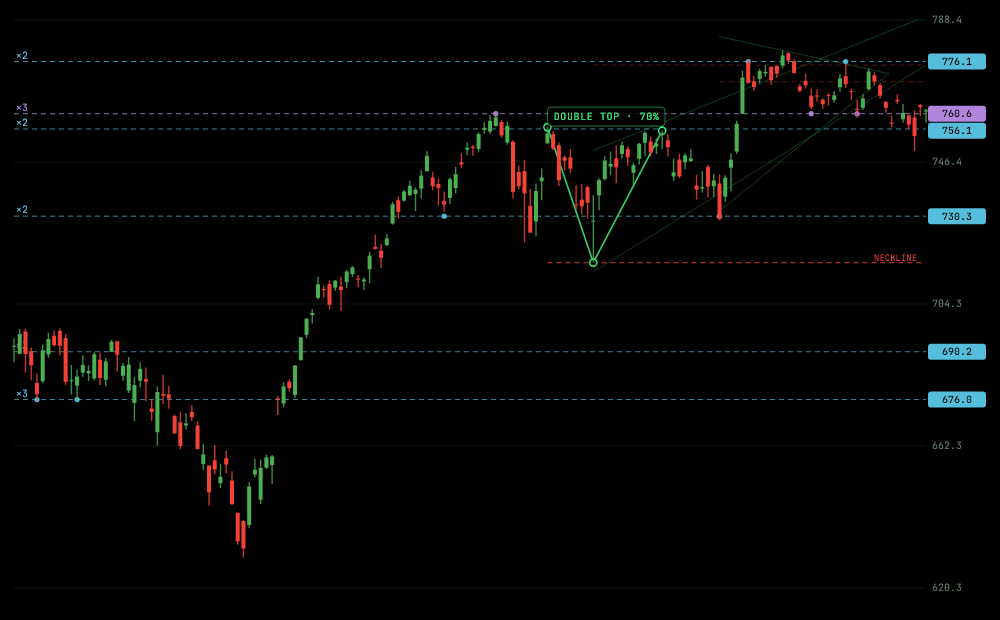
Support and resistance are prices where a chart has turned before. That is the whole idea. Everything else in this guide is about telling a level that means something from a line someone drew.
The short answer
- Support is a price below the current price where the market has turned up before.
- Resistance is a price above the current price where the market has turned down before.
- Both are records of the past. They describe what price did at that spot, not what it will do next.
Why the same prices keep showing up
A common explanation is memory. People who bought at a price and watched it fall may want out when it returns to that price. Others who missed a move may be waiting for a return to it. Orders and decisions cluster around prices that mattered before, and that clustering can show up as a turn.
That is an explanation for why levels are worth looking at, not a rule. Some levels hold many times. Others give way the first time they are tested. Nothing on a chart can tell you in advance which kind you are looking at.
Levels are zones, not razor lines
Price rarely turns at exactly the same number twice. One swing low might be 190.10, the next 189.60, the next 190.40. Treat those as one level around 190, a narrow band rather than a hairline. A tool that draws a single thin line through one of those lows has quietly made a choice about which one to trust.
What a "touch" is, and why the count matters
A touch is one occasion when price came to a level and turned. A level touched twice has a small record. A level touched five times has a larger one. The count is the difference between "a line I drew" and "a price where the market turned five times".
More touches is not automatically better. A level that has been tested many times may be worn down by each test, and one last tested a year ago says less than one tested last month. So a good read gives you both: how many times, and how recently.
For example, “190.4, tested 5 times, last tested 12 days ago” is a fact about the past. “Strong support at 190.4” is an opinion with a number attached.
When support becomes resistance
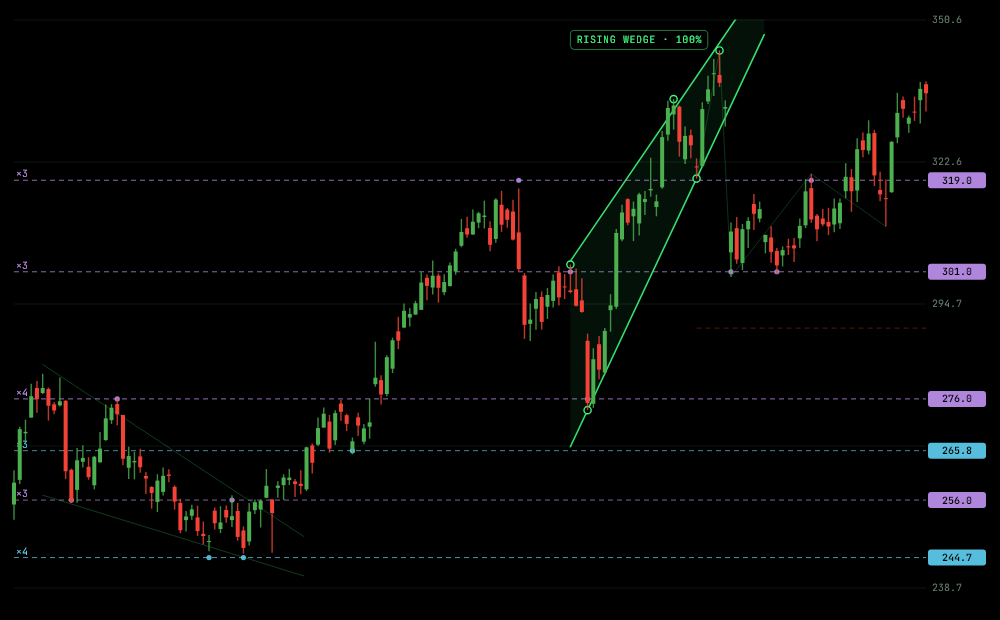
A level can change sides. Price falls through a support level, later rallies back up to it, and turns down from the same price. The old floor has become a ceiling. The reverse happens too.
These are sometimes called flip levels because the price has been respected from both sides. In ChartPro they are drawn in purple, and they matter because they show a level that has been tested in both directions.
What levels cannot tell you
- Where price goes next. A level records the past. It makes no promise about the future.
- Whether the next test will hold. Levels break. Sometimes on the first test.
- What to do. A level is a fact about a chart. Whether and how to act on it is your decision and depends on things a chart does not know: your goals, your risk, your costs.
What a level can do is put a number on where the chart's history says something happened, so your own reasoning starts from facts instead of impressions.
Common mistakes
- Drawing too many lines. If a chart has a dozen levels, none of them stands out. A handful with real histories beats a page of lines.
- Using one exact number. Prices near a level count as the same level.
- Ignoring the timeframe. A level on a daily chart and a level on a 5-minute chart are different objects. Say which one you mean.
- Treating a level as a guarantee. It is a record.
How ChartPro finds them
ChartPro does not guess levels from a picture. It takes the real price bars, finds each swing high and swing low, groups the ones that sit close together, and counts how many times price turned there. A level needs at least two touches to appear, and only the six strongest are shown, ranked by how many times they were tested and how recently. The next guide walks through the same steps by hand.
Questions people ask
Is support and resistance a prediction?
No. It is a description of where price has turned before. Anyone who tells you a level "will hold" is making a prediction the chart cannot back up.
How many touches make a level real?
There is no magic number. Two touches is the minimum for it to be a pattern at all. Beyond about four, extra touches add little, and very old touches count for less than recent ones.
Do support and resistance work on any market?
Levels can be measured on any chart with price data: stocks, indices, forex, commodities and crypto. What a level means still depends on the instrument and the timeframe.