How to analyze a chart screenshot without guessing
A screenshot of a chart is a picture of prices, not the prices themselves. The reliable way to analyze one is to use the picture only to work out which chart it is, then get the real numbers from a data source.
Why reading levels off a picture goes wrong
Some tools send your screenshot to an AI model and ask what the levels are. The model looks at the shapes and answers with numbers that sound reasonable. The trouble is that a picture has no precise prices in it. Axis labels are small, candles are a few pixels wide, and a model can be confidently wrong by a wide margin without any sign that it has guessed.
You get a level that looks like an analysis but has nothing behind it: no bars counted, no touches, nothing you could check.
The approach that holds up
- Read the label. Charts print what they are, usually in the top left: ticker, exchange, timeframe. That short piece of text is all that is needed from the image.
- Get the real bars. With the ticker and timeframe known, fetch the actual price data for that instrument.
- Compute. Find the swing points, group them, count the touches, as in this method. Every number now comes from real data and can be checked.
This is how ChartPro works. The only thing an AI model is asked to do is read the label. It is never asked what the chart means or where a level is.
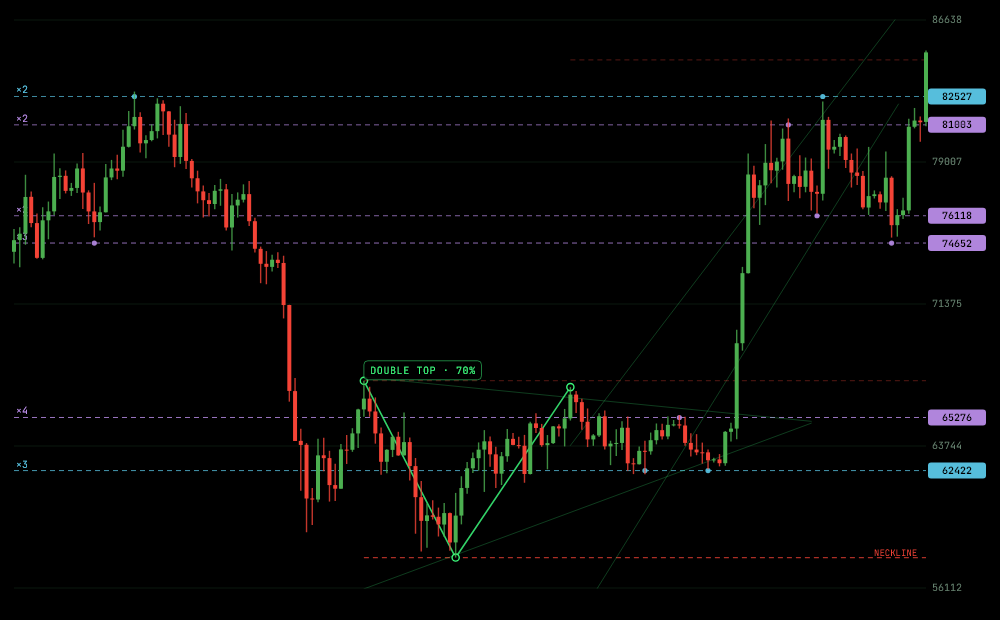
How to take a screenshot that works
- Keep the ticker and timeframe in the frame. They are usually top left. If they are cropped out, there is nothing to read.
- Crop to the chart. Browser tabs, toolbars and other windows add noise.
- Use a straight-on capture. A direct screenshot beats an angled photo of a screen.
- Avoid glare if you photograph a display.
- Make sure the text is legible. If you cannot read the ticker at a glance, the reader may not either.
What names it understands
Stocks and ETFs, major indices (for example US30, Nasdaq 100, DAX, CAC 40, FTSE 100), forex pairs (EUR/USD, GBP/JPY), metals and energy (gold, silver, crude oil), and crypto. Broker-style names are translated to the data source's symbols: XAU/USD is analyzed on gold futures, and the result says so.
Some things cannot be analyzed: instruments whose prices are not available from the data source, such as rupee-quoted commodity contracts on MCX. The app tells you so instead of substituting a similar-looking instrument.
A note on short timeframes
Very short timeframes only have a short history available. A 5-minute chart is analyzed over the most recent days, not months. Levels found there describe recent behaviour on that timeframe.
If it cannot read your screenshot
You are asked to confirm or type the instrument, and it takes a few seconds. Typing a ticker does not use a scan credit. Credits are only spent when a scan is read successfully, so a failed read costs nothing.
Questions people ask
Does the AI look at my candles or my drawn lines?
No. It is asked to read the ticker and timeframe printed on the chart and nothing else. Lines you drew and indicators on your screenshot are ignored.
Is my screenshot stored?
The image is sent once to read the label and is not kept. See the privacy policy for the details.
Why don't the levels match the ones I drew?
Levels found by a fixed method from real bars can differ from ones drawn by eye. The touch counts let you check which touches produced each level.